Skip to content

phlex-echarts Starter App — Setup Guide

Run these commands in order. Each section is self-contained. Total time: approximately 5–10 minutes.

If you wish to bypass the build instructions, you can always download the basic working copy phlex-echarts-starter.zip

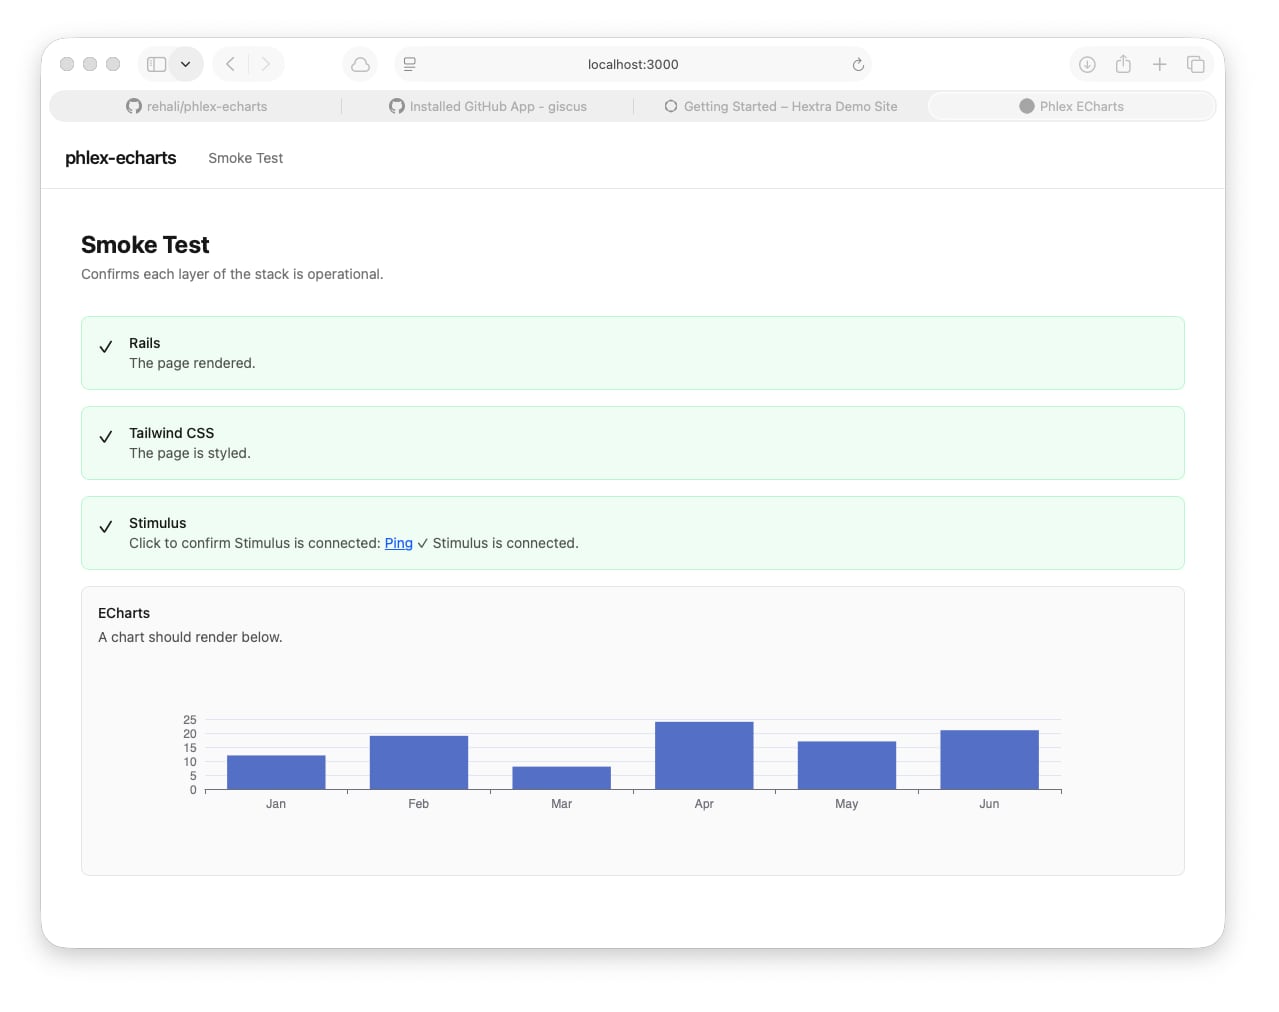
The end result should be a basic working app:

smoke_test.jpg


1. Generate the Rails app

1
2
3
4
5
6
7
8
9
rails new phlex-echarts \
  --css=tailwind \
  --javascript=importmap \
  --database=sqlite3 \
  --skip-jbuilder \
  --skip-action-mailbox \
  --skip-action-text

cd phlex-echarts

2. Add gems

1
2
bundle add phlex-rails
bundle add literal

3. Pin ECharts

1
bin/importmap pin echarts --from jsdelivr

Then open config/importmap.rb and verify the echarts line references the ESM build. If it does not contain esm in the filename, replace it manually:

1
pin "echarts", to: "https://cdn.jsdelivr.net/npm/echarts@5.6.0/dist/echarts.esm.min.js"

4. Install Phlex

1
rails generate phlex:install

5. Write application files

Create our initial application_layout and a default route.

app/views/layouts/application.html.erb

Replace the generated layout with:

 1
 2
 3
 4
 5
 6
 7
 8
 9
10
11
12
13
14
15
16
17
18
19
20
21
22
23
24
25
26
27
28
29
30
31
<!DOCTYPE html>
<html>
  <head>
    <title>Phlex ECharts</title>
    <meta name="viewport" content="width=device-width,initial-scale=1">
    <%= csrf_meta_tags %>
    <%= csp_meta_tag %>
    <%= stylesheet_link_tag "application", "data-turbo-track": "reload" %>
    <%= javascript_importmap_tags %>
  </head>

  <body class="min-h-screen bg-white text-neutral-900">
    <nav class="border-b border-neutral-200 px-6 py-4 flex items-center gap-8">
      <span class="font-semibold text-lg tracking-tight">phlex-echarts</span>
      <div class="flex gap-6 text-sm text-neutral-500">
        <%= link_to "Smoke Test", smoke_path, class: "hover:text-neutral-900" %>
      </div>
    </nav>

    <% if notice.present? %>
      <div class="px-6 py-3 bg-green-50 text-green-800 text-sm"><%= notice %></div>
    <% end %>
    <% if alert.present? %>
      <div class="px-6 py-3 bg-red-50 text-red-800 text-sm"><%= alert %></div>
    <% end %>

    <main class="max-w-6xl mx-auto px-6 py-10">
      <%= yield %>
    </main>
  </body>
</html>

config/routes.rb

1
2
3
4
5
6
# config/routes.rb
Rails.application.routes.draw do
  get "smoke", to: "smoke#index", as: :smoke
  get "up" => "rails/health#show", as: :rails_health_check
  root "smoke#index"
end

app/controllers/smoke_controller.rb

1
2
3
4
5
# app/controllers/smoke_controller.rb
class SmokeController < ApplicationController
  def index
  end
end

app/views/smoke/index.html.rb

 1
 2
 3
 4
 5
 6
 7
 8
 9
10
11
12
13
14
15
16
17
18
19
20
21
22
23
24
25
26
27
28
29
30
31
32
33
34
35
36
37
38
39
40
41
42
43
44
45
46
47
48
49
50
51
52
53
54
55
56
57
58
59
60
61
62
63
64
65
66
67
68
69
70
71
72
73
74
75
# app/views/smoke/index.html.rb
class Views::Smoke::Index < Views::Base
  def view_template
    div(class: "space-y-10") do
      div do
        h1(class: "text-2xl font-bold mb-1") { "Smoke Test" }
        p(class: "text-neutral-500 text-sm") { "Confirms each layer of the stack is operational." }
      end

      div(class: "grid gap-4") do
        check("Rails", "The page rendered.", true)
        check("Phlex", "This view is a Phlex component.", true)
        check("Tailwind CSS", "The page is styled with utility classes.", true)
        stimulus_check
        echarts_check
      end
    end
  end

  private

  def check(label, detail, passing)
    div(class: "flex items-start gap-4 p-4 rounded-lg border #{passing ? 'border-green-200 bg-green-50' : 'border-red-200 bg-red-50'}") do
      span(class: "text-lg mt-0.5") { passing ? "✓" : "✗" }
      div do
        p(class: "font-medium text-sm") { label }
        p(class: "text-sm text-neutral-600") { detail }
      end
    end
  end

  def stimulus_check
    div(
      class: "flex items-start gap-4 p-4 rounded-lg border border-neutral-200 bg-neutral-50",
      data: { controller: "smoke" }
    ) do
      span(class: "text-lg mt-0.5", data: { smoke_target: "icon" }) { "?" }
      div do
        p(class: "font-medium text-sm") { "Stimulus" }
        p(class: "text-sm text-neutral-600") do
          plain "Click to confirm Stimulus is connected: "
          button(
            class: "underline text-blue-600",
            data: { action: "click->smoke#ping" }
          ) { "Ping" }
          plain " "
          span(data: { smoke_target: "result" }) { "" }
        end
      end
    end
  end

  def echarts_check
    div(class: "p-4 rounded-lg border border-neutral-200 bg-neutral-50") do
      p(class: "font-medium text-sm mb-1") { "ECharts" }
      p(class: "text-sm text-neutral-600 mb-3") { "A chart should render below. If empty, check the browser console." }
      div(
        data: {
          controller: "smoke-chart",
          smoke_chart_options_value: smoke_chart_options.to_json
        },
        style: "height: 200px; width: 100%;"
      )
    end
  end

  def smoke_chart_options
    {
      grid: { top: 20, bottom: 30, left: 40, right: 20 },
      xAxis: { type: "category", data: %w[Jan Feb Mar Apr May Jun] },
      yAxis: { type: "value" },
      series: [{ type: "bar", data: [12, 19, 8, 24, 17, 21] }]
    }
  end
end

app/javascript/controllers/smoke_controller.js

 1
 2
 3
 4
 5
 6
 7
 8
 9
10
11
12
13
// app/javascript/controllers/smoke_controller.js
import { Controller } from "@hotwired/stimulus"

export default class extends Controller {
  static targets = ["result", "icon"]

  ping() {
    this.resultTarget.textContent = "✓ Stimulus is connected."
    this.iconTarget.textContent = "✓"
    this.element.classList.replace("border-neutral-200", "border-green-200")
    this.element.classList.replace("bg-neutral-50", "bg-green-50")
  }
}

app/javascript/controllers/smoke_chart_controller.js

 1
 2
 3
 4
 5
 6
 7
 8
 9
10
11
12
13
14
15
16
17
18
19
20
21
22
23
// app/javascript/controllers/smoke_chart_controller.js
import { Controller } from "@hotwired/stimulus"
import * as echarts from "echarts"

export default class extends Controller {
  static values = {
    options: { type: Object, default: {} }
  }

  connect() {
    this.chart = echarts.init(this.element, null, { renderer: "svg" })
    this.chart.setOption(this.optionsValue, { notMerge: true })

    this.resizeObserver = new ResizeObserver(() => this.chart?.resize())
    this.resizeObserver.observe(this.element)
  }

  disconnect() {
    this.resizeObserver?.disconnect()
    this.chart?.dispose()
    this.chart = null
  }
}

6. Migrations

 1
 2
 3
 4
 5
 6
 7
 8
 9
10
11
12
13
14
15
16
17
18
rails generate migration CreateGdpReadings \
  industry:string year:integer quarter:integer value_billions:decimal

rails generate migration CreateLabourForceReadings \
  state:string year:integer month:integer \
  employed_thousands:decimal unemployed_thousands:decimal \
  participation_rate:decimal unemployment_rate:decimal

rails generate migration CreateCpiReadings \
  category:string year:integer quarter:integer index_value:decimal

rails generate migration CreateLeadingIndexReadings \
  year:integer month:integer index_value:decimal

rails generate migration CreateDailyActivityReadings \
  date:date value:decimal

rails db:migrate

7. Models

app/models/gdp_reading.rb

 1
 2
 3
 4
 5
 6
 7
 8
 9
10
11
# app/models/gdp_reading.rb
class GdpReading < ApplicationRecord
  validates :industry, :year, :quarter, :value_billions, presence: true

  scope :by_year,     ->(y)  { where(year: y) }
  scope :by_industry, ->(i)  { where(industry: i) }
  scope :ordered,     ->     { order(:year, :quarter) }

  def self.industries = distinct.pluck(:industry).sort
  def self.years      = distinct.pluck(:year).sort
end

app/models/labour_force_reading.rb

 1
 2
 3
 4
 5
 6
 7
 8
 9
10
11
# app/models/labour_force_reading.rb
class LabourForceReading < ApplicationRecord
  validates :state, :year, :month, presence: true

  scope :for_state,   ->(s) { where(state: s) }
  scope :by_year,     ->(y) { where(year: y) }
  scope :ordered,     ->    { order(:year, :month) }

  def self.states = distinct.pluck(:state).sort
  def self.years  = distinct.pluck(:year).sort
end

app/models/cpi_reading.rb

 1
 2
 3
 4
 5
 6
 7
 8
 9
10
11
# app/models/cpi_reading.rb
class CpiReading < ApplicationRecord
  validates :category, :year, :quarter, :index_value, presence: true

  scope :by_year,     ->(y) { where(year: y) }
  scope :by_category, ->(c) { where(category: c) }
  scope :ordered,     ->    { order(:year, :quarter) }

  def self.categories = distinct.pluck(:category).sort
  def self.years      = distinct.pluck(:year).sort
end

app/models/leading_index_reading.rb

1
2
3
4
5
6
7
8
# app/models/leading_index_reading.rb
class LeadingIndexReading < ApplicationRecord
  validates :year, :month, :index_value, presence: true

  scope :ordered,  -> { order(:year, :month) }
  scope :by_year,  ->(y) { where(year: y) }
  scope :recent,   ->(n) { ordered.last(n) }
end

app/models/daily_activity_reading.rb

1
2
3
4
5
6
7
8
# app/models/daily_activity_reading.rb
class DailyActivityReading < ApplicationRecord
  validates :date, :value, presence: true

  scope :ordered,    ->          { order(:date) }
  scope :for_year,   ->(y)       { where(date: Date.new(y)..Date.new(y).end_of_year) }
  scope :for_range,  ->(from, to) { where(date: from..to) }
end

8. Seed data files

We have a generator file to create our initial datasets:

  1
  2
  3
  4
  5
  6
  7
  8
  9
 10
 11
 12
 13
 14
 15
 16
 17
 18
 19
 20
 21
 22
 23
 24
 25
 26
 27
 28
 29
 30
 31
 32
 33
 34
 35
 36
 37
 38
 39
 40
 41
 42
 43
 44
 45
 46
 47
 48
 49
 50
 51
 52
 53
 54
 55
 56
 57
 58
 59
 60
 61
 62
 63
 64
 65
 66
 67
 68
 69
 70
 71
 72
 73
 74
 75
 76
 77
 78
 79
 80
 81
 82
 83
 84
 85
 86
 87
 88
 89
 90
 91
 92
 93
 94
 95
 96
 97
 98
 99
100
101
102
103
104
105
106
107
108
109
110
111
112
113
114
115
116
117
118
119
120
121
122
123
124
125
126
127
128
129
130
131
132
133
134
135
136
137
138
139
140
141
142
143
144
145
146
147
148
149
150
151
152
153
154
155
156
157
158
159
160
161
162
163
164
165
166
167
168
169
170
171
172
173
174
175
176
177
178
179
180
181
182
183
184
185
186
187
188
189
190
191
192
193
194
195
196
197
198
199
200
201
202
203
204
205
206
207
208
209
210
211
212
213
214
215
216
217
218
219
220
221
222
223
224
225
226
227
228
229
230
231
232
233
234
235
236
237
238
239
240
241
242
243
244
245
246
247
248
249
250
251
252
253
254
255
256
257
258
# db/seeds/generate.rb
#
# Generates seed data JSON files for the phlex-echarts tutorial.
# Run from the Rails root: ruby db/seeds/generate.rb
#
# Output files (gitignored, generated locally):
#   db/seeds/gdp_data.json
#   db/seeds/labour_force_data.json
#   db/seeds/cpi_data.json
#   db/seeds/leading_index_data.json
#   db/seeds/daily_activity_data.json
#
# Deterministic: uses a hand-rolled LCG so output is identical across
# all Ruby versions.

require "json"
require "date"

# ── Deterministic RNG (Linear Congruential Generator) ────────────────────────
# Parameters from Numerical Recipes. Version-independent — does not use
# Ruby's built-in Random, so output is stable across Ruby versions.
class LCG
  M = 2**32
  A = 1664525
  C = 1013904223

  def initialize(seed)
    @state = seed
  end

  # Returns a float in [0, 1)
  def rand
    @state = (A * @state + C) % M
    @state.to_f / M
  end

  # Returns a float in [min, max)
  def rand_float(min, max)
    min + rand * (max - min)
  end

  # Returns an approximation of a normal distribution via Box-Muller
  def rand_normal(mean, sd)
    u1 = [rand, 1e-10].max
    u2 = rand
    z  = Math.sqrt(-2.0 * Math.log(u1)) * Math.cos(2 * Math::PI * u2)
    mean + z * sd
  end

  def clamp(value, min, max)
    [[value, min].max, max].min
  end
end

rng = LCG.new(42)
output_dir = File.expand_path("../seeds", __dir__)

# ── GDP readings ──────────────────────────────────────────────────────────────
# 10 industries × 4 quarters × 24 years (2000–2023) = 960 records
puts "Generating GDP readings..."

industries = {
  "Agriculture"          => { base: 8.0,   trend: 0.04,  vol: 0.6  },
  "Mining"               => { base: 28.0,  trend: 0.18,  vol: 2.1  },
  "Manufacturing"        => { base: 32.0,  trend: 0.05,  vol: 1.2  },
  "Construction"         => { base: 22.0,  trend: 0.14,  vol: 1.4  },
  "Retail Trade"         => { base: 18.0,  trend: 0.08,  vol: 0.9  },
  "Financial Services"   => { base: 38.0,  trend: 0.22,  vol: 2.4  },
  "Health Care"          => { base: 24.0,  trend: 0.20,  vol: 1.0  },
  "Education"            => { base: 14.0,  trend: 0.12,  vol: 0.6  },
  "Professional Services"=> { base: 20.0,  trend: 0.19,  vol: 1.3  },
  "Public Administration"=> { base: 16.0,  trend: 0.10,  vol: 0.5  },
}

gdp_records = []
industries.each do |industry, cfg|
  value = cfg[:base]
  (2000..2023).each do |year|
    (1..4).each do |quarter|
      shock    = (year == 2020 && quarter == 2) ? -0.12 : 0.0
      seasonal = Math.sin((quarter / 4.0) * 2 * Math::PI) * cfg[:vol] * 0.3
      noise    = (rng.rand - 0.5) * cfg[:vol]
      value    = value * (1 + cfg[:trend] / 4.0 + shock) + seasonal + noise
      value    = [value, cfg[:base] * 0.5].max
      gdp_records << {
        industry:      industry,
        year:          year,
        quarter:       quarter,
        value_billions: value.round(2)
      }
    end
  end
end

File.write(File.join(output_dir, "gdp_data.json"), JSON.pretty_generate(gdp_records))
puts "  #{gdp_records.size} records written to gdp_data.json"

# ── Labour force readings ─────────────────────────────────────────────────────
# 8 states × 12 months × 12 years (2012–2023) = 1,152 records
puts "Generating labour force readings..."

states = {
  "NSW" => { employed_base: 3600.0, ur_base: 5.2 },
  "VIC" => { employed_base: 3000.0, ur_base: 5.6 },
  "QLD" => { employed_base: 2300.0, ur_base: 5.8 },
  "WA"  => { employed_base: 1300.0, ur_base: 4.8 },
  "SA"  => { employed_base:  800.0, ur_base: 6.0 },
  "TAS" => { employed_base:  230.0, ur_base: 6.8 },
  "ACT" => { employed_base:  210.0, ur_base: 3.4 },
  "NT"  => { employed_base:  120.0, ur_base: 4.2 },
}

lf_records = []
states.each do |state, cfg|
  employed = cfg[:employed_base]
  ur       = cfg[:ur_base]

  (2012..2023).each do |year|
    (1..12).each do |month|
      # COVID crash
      if year == 2020 && [4, 5].include?(month)
        employed *= 0.965
        ur       += 1.8
      elsif year == 2020 && (6..8).include?(month)
        employed *= 1.008
        ur       -= 0.4
      else
        employed *= (1 + 0.018 / 12.0)
        ur        = rng.clamp(ur * 0.998 + rng.rand_normal(0, 0.08), 2.0, 12.0)
      end

      # VIC second lockdown
      if state == "VIC" && year == 2020 && (7..9).include?(month)
        employed *= 0.975
        ur       += 0.6
      end

      seasonal      = Math.sin(((month - 1) / 12.0) * 2 * Math::PI) * 15.0
      employed_val  = employed + seasonal + rng.rand_normal(0, employed * 0.003)
      participation = rng.clamp(65.0 + (year - 2012) * 0.05 + rng.rand_normal(0, 0.2), 60.0, 72.0)
      unemployed_val = employed_val * (ur / 100.0) / (1.0 - ur / 100.0)

      lf_records << {
        state:                 state,
        year:                  year,
        month:                 month,
        employed_thousands:    employed_val.round(1),
        unemployed_thousands:  [unemployed_val, 1.0].max.round(1),
        participation_rate:    participation.round(1),
        unemployment_rate:     ur.round(1)
      }
    end
  end
end

File.write(File.join(output_dir, "labour_force_data.json"), JSON.pretty_generate(lf_records))
puts "  #{lf_records.size} records written to labour_force_data.json"

# ── CPI readings ──────────────────────────────────────────────────────────────
# 8 categories × 4 quarters × 32 years (1992–2023) = 1,024 records
puts "Generating CPI readings..."

categories = {
  "Food & Non-Alcoholic Beverages" => { base: 60.0,  trend:  0.030 },
  "Housing"                        => { base: 55.0,  trend:  0.038 },
  "Transport"                      => { base: 58.0,  trend:  0.025 },
  "Health"                         => { base: 52.0,  trend:  0.042 },
  "Education"                      => { base: 48.0,  trend:  0.048 },
  "Recreation & Culture"           => { base: 72.0,  trend:  0.010 },
  "Clothing & Footwear"            => { base: 95.0,  trend: -0.005 },
  "Communication"                  => { base: 130.0, trend: -0.018 },
}

cpi_records = []
categories.each do |category, cfg|
  value = cfg[:base]
  (1992..2023).each do |year|
    (1..4).each do |quarter|
      extra = [2021, 2022].include?(year) ? 0.004 : 0.0
      noise = rng.rand_normal(0, 0.4)
      value = value * (1 + cfg[:trend] / 4.0 + extra) + noise
      value = [value, 20.0].max
      cpi_records << {
        category:    category,
        year:        year,
        quarter:     quarter,
        index_value: value.round(1)
      }
    end
  end
end

File.write(File.join(output_dir, "cpi_data.json"), JSON.pretty_generate(cpi_records))
puts "  #{cpi_records.size} records written to cpi_data.json"

# ── Leading index readings ────────────────────────────────────────────────────
# Monthly 2000–2023 = 288 records
puts "Generating leading index readings..."

leading_records = []
value = 100.0
(2000..2023).each do |year|
  (1..12).each do |month|
    delta = if year == 2008 && month >= 9
              rng.rand_normal(-0.8, 0.3)
            elsif year == 2009 && month <= 6
              rng.rand_normal(-0.4, 0.3)
            elsif year == 2009 && month > 6
              rng.rand_normal(0.5, 0.2)
            elsif year == 2020 && [3, 4].include?(month)
              rng.rand_normal(-3.2, 0.4)
            elsif year == 2020 && (5..8).include?(month)
              rng.rand_normal(1.4, 0.3)
            elsif [2022, 2023].include?(year)
              rng.rand_normal(-0.15, 0.25)
            else
              rng.rand_normal(0.12, 0.22)
            end

    value = rng.clamp(value + delta, 80.0, 125.0)
    leading_records << { year: year, month: month, index_value: value.round(2) }
  end
end

File.write(File.join(output_dir, "leading_index_data.json"), JSON.pretty_generate(leading_records))
puts "  #{leading_records.size} records written to leading_index_data.json"

# ── Daily activity readings ───────────────────────────────────────────────────
# Daily 2018–2023 = 2,191 records
puts "Generating daily activity readings..."

daily_records = []
value   = 100.0
current = Date.new(2018, 1, 1)
last    = Date.new(2023, 12, 31)

while current <= last
  doy      = current.yday
  seasonal = Math.sin((doy / 365.0) * 2 * Math::PI) * 10.0

  drift = if current >= Date.new(2020, 3, 15) && current <= Date.new(2020, 5, 31)
            -0.3
          elsif current >= Date.new(2020, 6, 1) && current <= Date.new(2020, 12, 31)
            0.15
          else
            0.02
          end

  value = rng.clamp(value + drift + seasonal * 0.04 + rng.rand_normal(0, 1.8), 55.0, 165.0)
  daily_records << { date: current.iso8601, value: value.round(2) }
  current = current.next_day
end

File.write(File.join(output_dir, "daily_activity_data.json"), JSON.pretty_generate(daily_records))
puts "  #{daily_records.size} records written to daily_activity_data.json"

puts "\nDone. All files written to db/seeds/."
puts "These files are gitignored — run this script after cloning to regenerate them."

db/seeds.rb

 1
 2
 3
 4
 5
 6
 7
 8
 9
10
11
12
13
14
15
16
17
18
19
20
21
22
23
24
25
26
27
28
29
30
31
32
33
34
35
36
37
38
39
40
41
42
43
44
45
46
47
48
49
50
51
52
53
54
55
56
57
58
59
60
61
62
63
64
65
66
67
68
69
70
71
72
73
74
75
76
77
# db/seeds.rb
require "json"

puts "Seeding GDP readings..."
gdp_data = JSON.parse(File.read(Rails.root.join("db/seeds/gdp_data.json")))
gdp_data.each do |row|
  GdpReading.find_or_create_by!(
    industry: row["industry"],
    year:     row["year"],
    quarter:  row["quarter"]
  ) do |r|
    r.value_billions = row["value_billions"]
  end
end
puts "  #{GdpReading.count} GDP readings seeded."

puts "Seeding labour force readings..."
labour_data = JSON.parse(File.read(Rails.root.join("db/seeds/labour_force_data.json")))
labour_data.each do |row|
  LabourForceReading.find_or_create_by!(
    state: row["state"],
    year:  row["year"],
    month: row["month"]
  ) do |r|
    r.employed_thousands    = row["employed_thousands"]
    r.unemployed_thousands  = row["unemployed_thousands"]
    r.participation_rate    = row["participation_rate"]
    r.unemployment_rate     = row["unemployment_rate"]
  end
end
puts "  #{LabourForceReading.count} labour force readings seeded."

puts "Seeding CPI readings..."
cpi_data = JSON.parse(File.read(Rails.root.join("db/seeds/cpi_data.json")))
cpi_data.each do |row|
  CpiReading.find_or_create_by!(
    category: row["category"],
    year:     row["year"],
    quarter:  row["quarter"]
  ) do |r|
    r.index_value = row["index_value"]
  end
end
puts "  #{CpiReading.count} CPI readings seeded."

puts "Seeding leading index readings..."
leading_data = JSON.parse(File.read(Rails.root.join("db/seeds/leading_index_data.json")))
leading_data.each do |row|
  LeadingIndexReading.find_or_create_by!(
    year:  row["year"],
    month: row["month"]
  ) do |r|
    r.index_value = row["index_value"]
  end
end
puts "  #{LeadingIndexReading.count} leading index readings seeded."

puts "Generating daily activity readings..."
srand(42)
start_date = Date.new(2020, 1, 1)
end_date   = Date.new(2023, 12, 31)
base_value = 100.0
value      = base_value

(start_date..end_date).each do |date|
  day_of_year    = date.yday
  seasonal_bias  = Math.sin((day_of_year / 365.0) * 2 * Math::PI) * 8
  random_walk    = (rand - 0.48) * 3
  value          = (value + random_walk + seasonal_bias * 0.1).clamp(60.0, 160.0)

  DailyActivityReading.find_or_create_by!(date: date) do |r|
    r.value = value.round(2)
  end
end
puts "  #{DailyActivityReading.count} daily activity readings generated."

puts "Done."

9. Verify

1
2
3
rails test
bin/dev
# visit http://localhost:3000/smoke

All five stack checks should pass. If ECharts fails to render, open the browser console — the most common cause is the importmap pin resolving to a CJS build rather than the ESM build. Check that the URL in config/importmap.rb contains esm in the filename.