1 The Tutorial Starter App — Setup Guide
The only prerequisite is a recent version of Ruby ( 3.4 or above prefered but should work with any 3.0 or greater)
1.1 - Get the starter app
Download and unzip the phlex-echarts-tutorial_starter.zip
From the app root folder run:
$ bundle install1.2 - Run the migrations and seed
The tutorial uses real ABS open data — seven datasets covering Australia’s economy from 2000–2024.
Run the migrations and seeds:
$ bin/rails db:migrate
$ bin/rails db:seed
1.3 - Run the app and check
Start the app (make sure you run bin\dev and not bin\rails server, so you get the Tailwind CSS built):
$ bin/devThe end result:
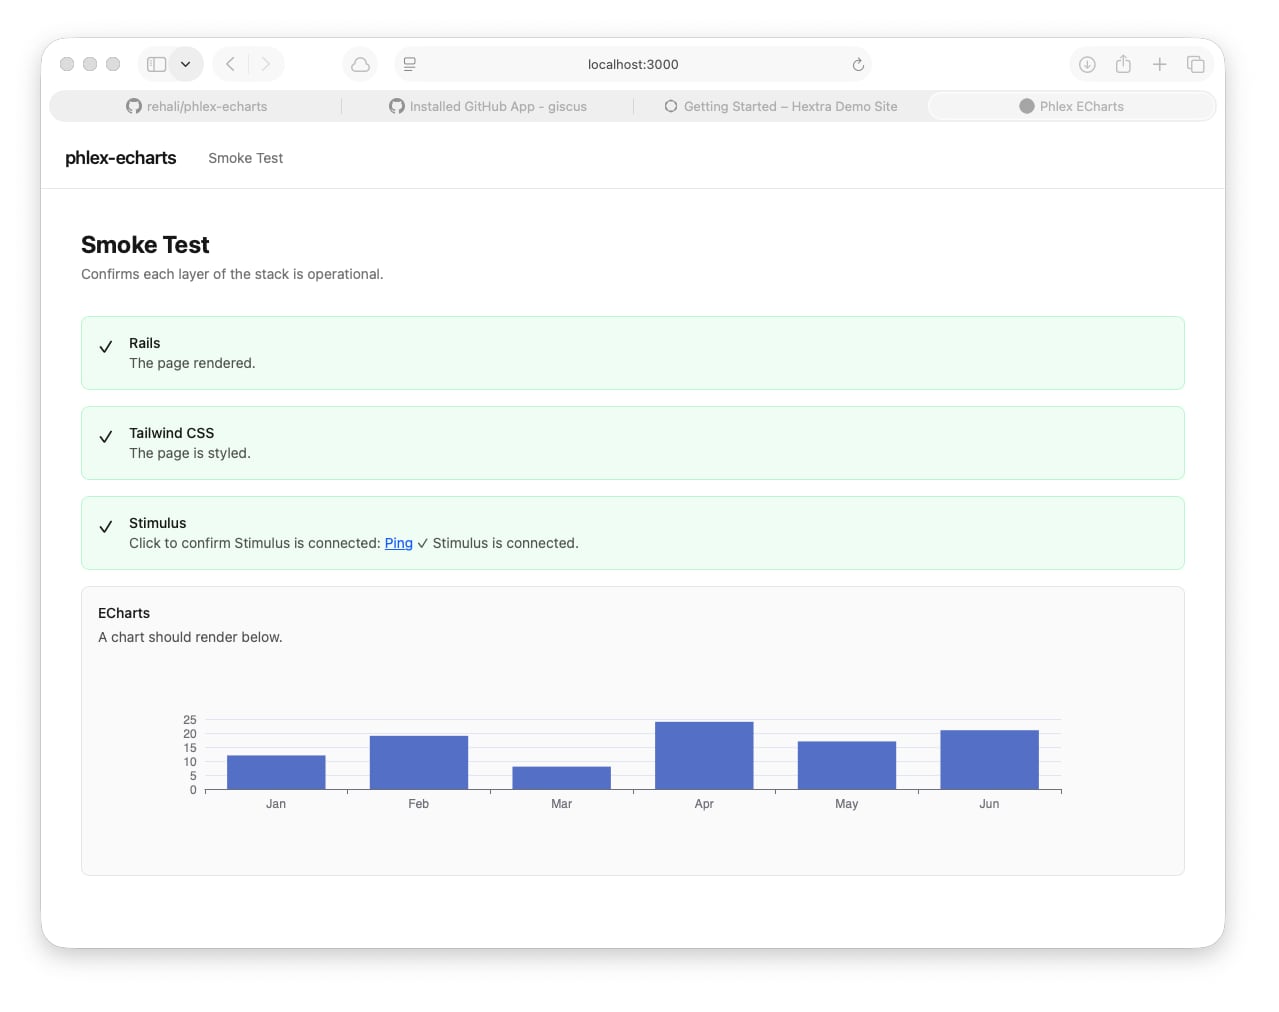
Note: there is a
Chartsmenu item in thenavbar. At the moment it’s a blank page waiting for the charts you will add. TheSmoke Testmakes sure that you’ve got all the components running correctly.
You’re now ready to proceed to Lesson 01 - Foundation
2 The Phlex-ECharts Library
Once you’ve completed the tutorial and you want to use these techniques in your own applications, you can download the Phlex-ECharts Library Generator file and use it in your own projects.
2.1
Copy the file to the root of you project and run
$ bin/rails g echarts:installThe generator adds the following files to your application
app/javascript/
  controllers/
    chart_controller.js          ← owns the ECharts instance lifecycle
  charts/
    chart_formatters.js          ← base formatter registry
    chart_palettes.js            ← 9 colour palettes
    custom_chart_formatters.js   ← your additions go here
    custom_chart_palettes.js     ← your additions go here
  channels/
    consumer.js                  ← ActionCable consumer

app/lib/chart/
  options.rb                     ← builds ECharts option hashes
  series/
    base.rb / line.rb / bar.rb / scatter.rb / pie.rb

app/views/components/
  chart.rb                       ← base Phlex chart component