Module 02 — The Ruby DSL: Building ECharts Options in Ruby
What We’re Building
In Module 01 we passed a raw Ruby hash to Components::Chart and it worked. That
approach scales poorly — raw hashes offer no type safety, no reuse, and no testability.
This module introduces the architecture that carries us through the rest of the series:
- A thin Ruby DSL in
app/lib/chart/for building ECharts option hashes - A service pattern in
app/services/stats/for transforming raw ActiveRecord data - Chart-specific Phlex components in
Components::Charts::*that wire the two together - Unit tests for all of the above in plain Ruby
Formatting — axis labels, tooltip presentation, number units — is deliberately absent from this module. Naked charts first; formatting in Module 03.
By the end, the controller will do nothing but fetch raw data. All transformation, configuration, and rendering logic lives where it belongs.
By the end of this module we’ll be able to write code like:
|
|
<%# app/views/charts/demo.html.erb %>
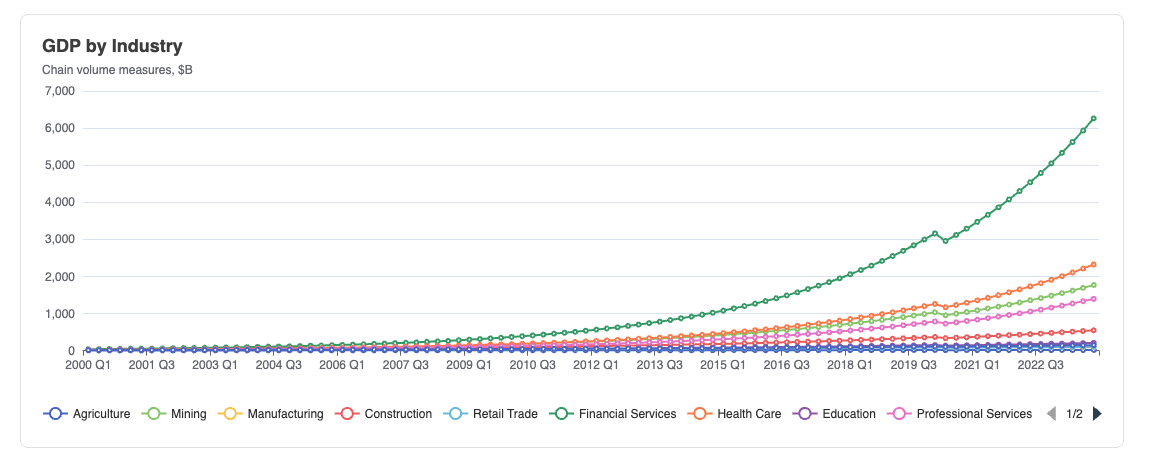
<h1 class="text-2xl font-bold mb-6">GDP by Industry</h1>
<%= render Components::Charts::GdpByIndustry.new(readings: @readings) %>which will create a chart like this (and with no javascript at all) :
2.1 — Design Principles
Three distinct layers, three distinct responsibilities.
Controller              — fetches raw ActiveRecord data, nothing else
Stats::*                — transforms raw data into clean domain structures
Components::Charts::*   — builds chart options from clean data, renders HTML
The service layer is chart-agnostic.
A Stats::* module does not know what its output will be used for. The same service
can feed a chart component, a PDF generator, an API response, or a CSV export.
It transforms data — full stop.
Chart-specific logic belongs in the chart component.
Converting clean domain data into ECharts series, axis labels, and colour assignments is chart-specific. It lives in the component, not the service.
Services are modules, not classes.
Data transformation services are procedural — they take input, return output, maintain
no state. A class adds nothing here. We use extend self to make the module directly
callable:
|
|
This pattern was articulated clearly by Dave Thomas: when you find yourself writing
SomeClass.new(params).call, ask whether the class is doing any real object work —
managing state across method calls, responding to messages over time. If the answer is
no, a module with extend self is more honest about what the code actually is.
Check out Dave’s work at: Stop Abusing Classes and Start writing Ruby (stop using classes). San Francisco Ruby Conference 2025
The DSL wraps what benefits from Ruby. Everything else stays as hashes.
app/lib/chart/ contains reusable machinery that knows nothing about your application
data. These objects serialise via #to_h and are testable in isolation.
Plain hashes are welcome.
Chart::Options accepts either DSL objects or plain hashes for every option. Plain
hashes pass through unchanged; DSL objects have #to_h called. This keeps call sites
clean for simple cases while leaving explicit objects available when needed.
2.2 — File Structure
app/
  lib/
    chart/
      options.rb
      title.rb
      tooltip.rb
      axis.rb
      series/
        base.rb
        line.rb
        bar.rb
        scatter.rb
        pie.rb
  services/
    stats/
      gdp_by_industry.rb
  views/
    components/
      chart.rb            ← updated base class
      charts/
        gdp_by_industry.rb
Autoloading
app/lib is not autoloaded by default. Add it to both autoload and eager load paths:
|
|
Run rails zeitwerk:check to confirm all constants resolve correctly before proceeding.
app/services is autoloaded automatically — no configuration needed.
Namespace note:
Datais a Ruby 3.2+ built-in class. UsingServices::Dataas a namespace causes constant lookup conflicts with Zeitwerk. UseStats::instead.
Constant references inside components
When referencing Chart:: or Stats:: constants from inside Components::Charts::*,
use the :: prefix to force top-level constant lookup:
|
|
Without ::, Ruby walks up the nesting chain and looks for
Components::Charts::Chart::Options first, which does not exist.
2.3 — The DSL Objects
Chart::Title
|
|
Chart::Tooltip
|
|
The **extra pattern is the escape hatch — any ECharts tooltip option the DSL does
not model can be passed through directly.
Chart::Axis
One class handles both X and Y axes.
|
|
Chart::Series::Base
|
|
Chart::Series::Line
|
|
Chart::Series::Bar
|
|
Chart::Series::Scatter
|
|
Chart::Series::Pie
|
|
Chart::Options
The top-level builder. Accepts DSL objects or plain hashes interchangeably. Owns serialisation.
|
|
2.4 — The Service Layer
Services live in app/services/stats/. Each is a module with extend self — directly
callable, no instantiation. A service knows about your ActiveRecord models and returns
clean domain data. It has no knowledge of charts, PDFs, or any consumer.
|
|
The return value is a plain Ruby hash. No ECharts concepts. No chart series. Just data.
Note .to_f on value_billions — ActiveRecord returns BigDecimal from the database.
Calling .to_f ensures ECharts receives a plain Ruby float, which serialises to an
unquoted JSON number. Without this, values arrive as quoted strings and ECharts
renders them incorrectly.
2.5 — The Updated Base Component
Update Components::Chart so subclasses provide their own options via chart_options:
|
|
Components::Chart no longer has an options prop — subclasses build their own
options internally via chart_options.
2.6 — The Chart Component
|
|
Plain hashes are used for tooltip, legend, x_axis, y_axis, and grid — the
common case. Chart::Series::Line is used explicitly because we want smooth: and
area: options available. This is the coercion pattern in practice — brevity by
default, explicit DSL objects when warranted.
2.7 — Controller and View
|
|
<%# app/views/charts/gdp.html.erb %>
<h1 class="text-2xl font-bold mb-6">GDP by Industry</h1>

<%= render Components::Charts::GdpByIndustry.new(readings: @readings) %>
The controller knows nothing about chart options. The view knows nothing about data transformation. Each layer does exactly one thing.
2.8 — The Escape Hatch
The DSL is intentionally incomplete. Pass plain hashes for anything it does not model:
|
|
You never need to wait for the DSL to support an ECharts feature.
2.9 — Testing
Testing the Service
|
|
Testing the DSL
|
|
Run with:
|
|
Fast, focused, no browser, no JavaScript.
2.10 — Module Summary
The three layers and their locations:
| Layer | Location | Responsibility |
|---|---|---|
| DSL | app/lib/chart/ |
Reusable option builders and serialisation |
| Service | app/services/stats/ |
Transform ActiveRecord data into clean domain structures |
| Component | app/views/components/charts/ |
Call service, build options, render HTML |
The DSL objects:
| Object | Purpose |
|---|---|
Chart::Options |
Top-level builder, owns serialisation, supports color: palette name |
Chart::Title |
Title and subtitle |
Chart::Tooltip |
Tooltip trigger |
Chart::Axis |
X and Y axes with convenience constructors |
Chart::Series::Line |
Line and area series |
Chart::Series::Bar |
Bar and stacked bar series |
Chart::Series::Scatter |
Scatter series |
Chart::Series::Pie |
Pie and donut series |
The rule: Services return data. Components build charts. The DSL builds option hashes. None of these know about each other’s concerns. Formatting is handled separately — see Module 03.
Next: Module 03 — Formatters and the JavaScript Bridge