Module 02 — Formatters and Colour Palettes
What We’re Building
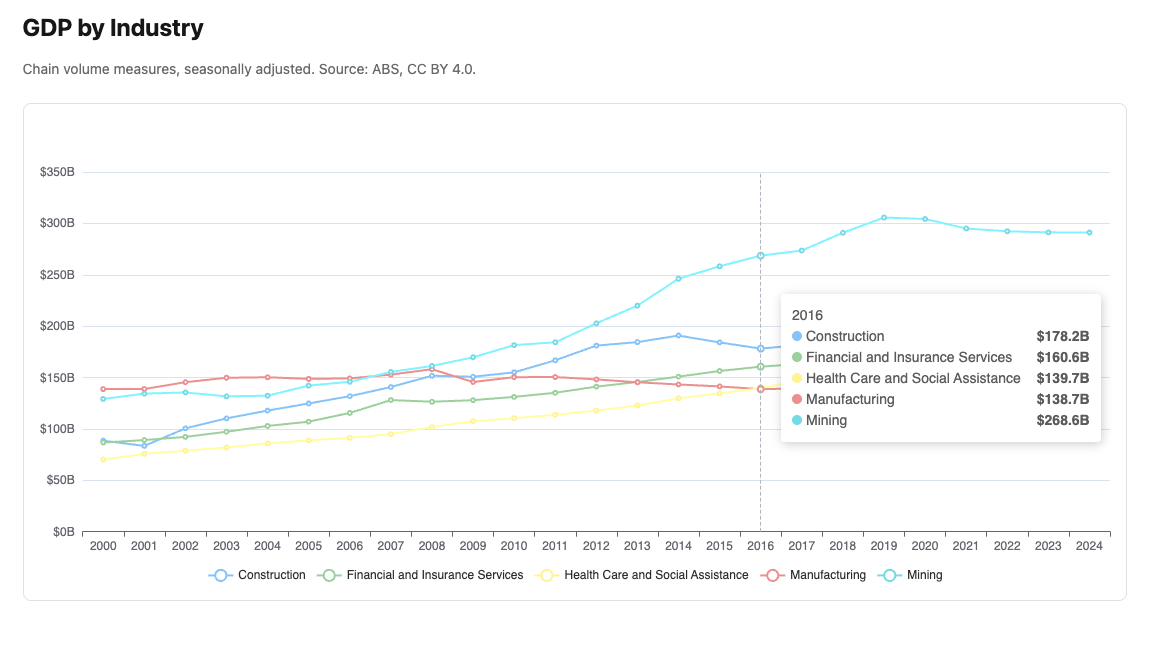
The GDP chart from Module 01 renders correctly but the numbers are raw — axis
labels show 351.882 instead of $352B, tooltips show a plain list of values
with no units. This module introduces the formatter and palette systems that make
charts readable.
By the end of this module you will have:
- Named formatters applied to axis labels and tooltips
- A colour palette applied to the chart
- The same chart looking significantly more polished
Here’s what we’ll be building, (different color palette, y-axis and tooltip now have units applied to the values):
2.1 — The Problem with JavaScript Formatters
ECharts formatters are JavaScript functions. A formatter function like:
|
|
cannot be serialised to JSON — functions are not valid JSON. We cannot pass them from Ruby to the browser via a data attribute.
The solution is a named formatter registry. Ruby passes a string name;
chart_controller.js resolves it to a function before calling setOption:
|
|
|
|
The base formatter registry in chart_formatters.js covers the most common
cases. You add application-specific formatters to custom_chart_formatters.js.
2.2 — Axis Label Formatters
Axis label formatters receive a single value — the tick value on the axis.
Reference them by name on axisLabel.formatter:
|
|
Available axis label formatters
| Name | Example output | Use for |
|---|---|---|
"integer" |
3,842 |
Whole numbers with thousands separator |
"percent" |
62% |
Whole number percentages |
"rate" |
3.8% |
One decimal place percentages |
"billions" |
$42B |
Dollar values in billions |
"millions" |
$1,234M |
Dollar values in millions |
"thousands" |
3,842k |
Values in thousands |
"currency" |
$42.3B / $500M |
Auto-scaling dollar values |
ECharts string templates also work and pass through unchanged:
|
|
Use named formatters when you need locale-aware number formatting or currency symbols. Use string templates for simple suffix/prefix additions.
2.3 — Tooltip Formatters
Tooltip formatters receive either a params array (axis trigger) or a single
params object (item trigger). The trigger key on the tooltip option provides
context — the resolver qualifies the lookup automatically:
|
|
You never need to write "axis:billions" in Ruby — the trigger qualifies it
for you.
Available tooltip formatters
| Name | Trigger | Output |
|---|---|---|
"default" |
axis / item | Plain value with thousands separator |
"billions" |
axis / item | $42.3B |
"millions" |
axis / item | $1,234M |
"thousands" |
axis / item | 3,842k |
"currency" |
axis / item | Auto-scaling $42.3B / $500M |
"rate" |
axis / item | 3.8% |
"percent" |
axis / item | 62% |
2.4 — Applying Formatters
Update the GDP chart from Module 01:
|
|
The axis labels now show $352B instead of 351.882. The tooltip shows a
formatted table with each industry’s value in billions.
2.5 — Colour Palettes
ECharts assigns colours to series in order from the color array. The palette
registry maps names to arrays:
|
|
chart_controller.js resolves "cool" to its colour array before calling
setOption. If you pass a colour array directly it passes through unchanged —
the registry is only consulted for string values.
Available palettes
| Name | Character |
|---|---|
"default" |
ECharts built-in — balanced and familiar |
"warm" |
Reds, oranges, yellows |
"cool" |
Blues, greens, purples — professional and calm |
"earth" |
Browns, tans, sage — grounded and natural |
"pastel" |
Soft muted tones |
"vivid" |
High saturation — bold |
"monochrome" |
Single blue hue — print-friendly |
"accessible" |
Okabe-Ito — colour-blind safe |
"tableau" |
Tableau classic — widely recognised |
Colour correspondence
Charts on the same page using the same palette assign colours in series order.
If two charts both use "tableau" and return series in the same order, NSW will
always be the same colour on both. This is why services sort consistently —
alphabetically by state or industry.
2.6 — Adding Custom Formatters
Add to custom_chart_formatters.js. Custom formatters override base formatters
when names clash:
|
|
Then from Ruby:
|
|
2.7 — Adding Custom Palettes
|
|
Then from Ruby:
|
|
2.8 — The Updated GDP Chart
With formatters and palette applied, the chart is significantly more readable. The full component:
|
|
Try changing color: to pick a different palette. Create and add a new custom palette of your own!
2.9 — Gallery
No new cards for our gallery here - just an updated chart.
2.10 — Module Summary
Patterns introduced:
- Named formatter registry — Ruby string, JavaScript function
- Trigger qualification —
formatter: "billions"resolves to"axis:billions"or"item:billions"automatically - Named palette registry —
color: "cool"resolves to colour array - Colour correspondence — same palette + same series order = same colour mapping
- Custom formatters in
custom_chart_formatters.js - Custom palettes in
custom_chart_palettes.js
The formatter principle:
Ruby passes names. JavaScript resolves them. You never write a JavaScript function to format a chart value — you name it once and reference it anywhere.